
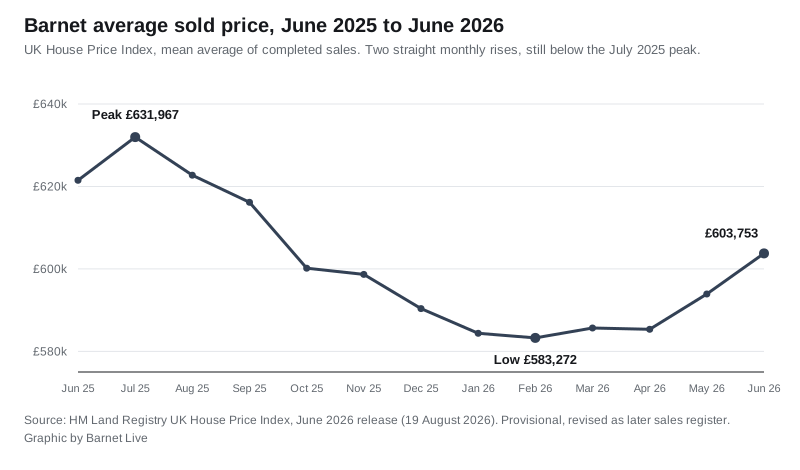
Barnet's average sold price rose to £603,753 in June, up £9,840 on May and the biggest monthly rise in eleven months. Still £28,214 below the July 2025 peak.
The average home in the London Borough of Barnet sold for £603,753 in June 2026. That is £9,840 more than in May, a rise of 1.7% in a single month.
The figure comes from HM Land Registry’s UK House Price Index, published on 19 August 2026. It is the second month in a row that the borough average has risen, and the biggest monthly rise in eleven months.
The year still reads as a fall. June 2025 averaged £621,488, so prices are down £17,735, or 2.9%, over twelve months. Barnet also remains £28,214 below its July 2025 peak of £631,967.
One thing to keep in mind throughout. The UK House Price Index is a mean average, not a median, so a handful of very large sales in a borough that contains The Bishops Avenue can move it. It is built from completed sales, not asking prices.
Two months up, after a year down
Barnet’s average peaked at £631,967 in July 2025, then fell for seven of the next eight months. It bottomed at £583,272 in February 2026. Since then it has recovered £20,481, or 3.5%.
| Month | Average price | Change on the month | Change on the year |
|---|---|---|---|
| June 2025 | £621,488 | +0.7% | +0.1% |
| July 2025 (peak) | £631,967 | +1.7% | +0.7% |
| August 2025 | £622,741 | -1.5% | -1.4% |
| September 2025 | £616,147 | -1.1% | -1.7% |
| October 2025 | £600,177 | -2.6% | -4.4% |
| November 2025 | £598,665 | -0.3% | -4.7% |
| December 2025 | £590,371 | -1.4% | -5.1% |
| January 2026 | £584,375 | -1.0% | -4.8% |
| February 2026 (low) | £583,272 | -0.2% | -3.8% |
| March 2026 | £585,670 | +0.4% | -4.0% |
| April 2026 | £585,349 | -0.1% | -4.1% |
| May 2026 | £593,913 | +1.5% | -3.7% |
| June 2026 | £603,753 | +1.7% | -2.9% |
The May figure has already changed
Anyone comparing this month’s release with last month’s will find the numbers have moved. That is normal, and worth stating plainly.
When the May index was published on 13 August, Barnet’s May average was £590,583 and the annual change was -4.3%. In this release, May reads £593,913, and the annual change for that month is -3.7%. The month was revised up by £3,330.
The whole back series shifted with it. The July 2025 peak was first reported at £633,066 and now reads £631,967. The February low was £582,243 and now reads £583,272.
Late-registered sales are the reason. A sale only enters the index once it is registered, which can take months, so the most recent months are provisional. We reported the May figure when it was published, and the June release supersedes it.
Seventh of the 33 London boroughs on the month
Barnet’s 1.7% monthly rise was the seventh largest of the 33 London boroughs in June. Twenty boroughs rose, twelve fell and one, Waltham Forest, was unchanged. London as a whole rose 1.0% on the month.
Over twelve months the picture is different, and Barnet sits with the fallers. Ranked by annual change to June 2026, from the same index:
- Hertsmere (Borehamwood, Potters Bar): £560,436, up 2.6%
- Haringey: £634,444, up 2.5%
- England: £293,262, up 1.8%
- Enfield: £471,019, up 0.3%
- Harrow: £524,160, down 1.4%
- London as a whole: £553,870, down 2.5%
- Barnet: £603,753, down 2.9%
- Brent: £544,174, down 3.4%
- Camden: £833,067, down 7.1%
Barnet’s average is now higher than every neighbouring authority except Camden, and £49,883 above the London average.
Every property type rose in June
All four types gained on the month, and all four are still down on the year.
| Type | June 2026 | On the month | On the year |
|---|---|---|---|
| Detached | £1,588,687 | +2.2% | -3.9% |
| Semi-detached | £847,804 | +1.4% | -2.6% |
| Terraced | £633,212 | +1.2% | -1.7% |
| Flat or maisonette | £377,851 | +1.9% | -3.4% |
Terraced houses have held their value best over the year, down 1.7%. Detached houses have fallen furthest, by 3.9%, which is £64,586 off the June 2025 average of £1,653,273.
The index also splits buyers. A first-time buyer in Barnet paid an average of £472,932 in June, up 1.6% on May and down 2.9% on the year. Someone moving from one home to another paid £790,433.
What it means for you
If you are selling, two rising months do not undo a year of falls, and the June figure is provisional. Price against completed sales in your own postcode rather than against the borough average, which is pulled upward by the very top of the market.
If you are buying, the negotiating room is narrower than it was in the spring, but the annual comparison is still negative. Flats fell 3.4% over the year and are the softest part of the market.
If you are staying put, nothing here changes your bill. Council tax is set on 1991 values, not current ones, so a price move does not shift your band. Our Barnet council tax bands page has the current rates.
For the fuller picture, including how the borough compares with portal averages and where the most expensive streets are, see our Barnet house prices page. The July 2026 index is due at 9.30am on Wednesday 16 September.
Sources
- UK House Price Index, Barnet, HM Land Registry, June 2026 release
- UK House Price Index reports and release dates, HM Land Registry
- Land Registry price paid search to check what an individual address sold for
Figures are provisional and revised as later sales register. Barnet Live checked them against the UK House Price Index on 23 August 2026.
Update, 17 September 2026: HM Land Registry’s July release revised Barnet’s June 2026 average down to £594,293, a rise of 0.9% on May and a fall of 4.4% on the year, rather than the £603,753, 1.7% and 2.9% first published. May now reads £589,011. The figures above are as first published. The July figures are in our July house prices report.
Have your say