
The average Barnet home sold for £590,583 in May 2026, £42,483 below last July's peak and 4.3% down in a year. Only Camden fell further among the neighbours; Haringey and Hertsmere rose.
Update, 23 August 2026: the June 2026 index has since been published, and it revised every figure below. May now reads £593,913, not £590,583, and -3.7% on the year, not -4.3%. The current numbers are in Barnet house prices rise £9,840 in a month to £603,753. The article below is kept as it was published on 16 August.
The average home in the London Borough of Barnet sold for £590,583 in May 2026, according to HM Land Registry’s UK House Price Index, published on 13 August. That is £26,356 less than a year earlier, a fall of 4.3%, and £42,483 below the peak of £633,066 recorded in July 2025.
Set against the boroughs and districts on Barnet’s border, only Camden has fallen further. Haringey and Hertsmere, on the eastern and northern edges, both rose over the same 12 months.
The May 2026 figure is the latest available. The Land Registry publishes the index roughly six weeks after the end of the month it describes, and the most recent months are provisional and get revised as late-registered sales arrive.
Twelve months of falling, three months of steadying
The borough’s average price climbed through the first half of 2025 and topped out at £633,066 in July. It then dropped for seven straight months to a low of £582,243 in February 2026. Since then it has edged up for three consecutive months, to £586,447 in March, £586,600 in April and £590,583 in May, a rise of 0.7% on the month. Every figure here is the Land Registry’s own monthly series for Barnet.
| Month | Average price | Annual change |
|---|---|---|
| May 2025 | £616,939 | +0.2% |
| June 2025 | £621,373 | +0.1% |
| July 2025 (peak) | £633,066 | +0.9% |
| August 2025 | £624,722 | -1.1% |
| September 2025 | £617,918 | -1.4% |
| October 2025 | £599,974 | -4.4% |
| November 2025 | £597,671 | -4.8% |
| December 2025 | £588,581 | -5.4% |
| January 2026 | £583,105 | -5.1% |
| February 2026 (low) | £582,243 | -3.9% |
| March 2026 | £586,447 | -3.8% |
| April 2026 | £586,600 | -3.9% |
| May 2026 | £590,583 | -4.3% |
The annual fall reads worse in May (4.3%) than in April (3.9%) even though the price rose, because May 2025 was itself a strong month. The gap between “prices are rising again” and “prices are still down on last year” is the whole story of the borough’s market at the moment.
How Barnet compares with its neighbours
Barnet borders six other local authorities. Ranked by the annual change to May 2026, from the same Land Registry index:
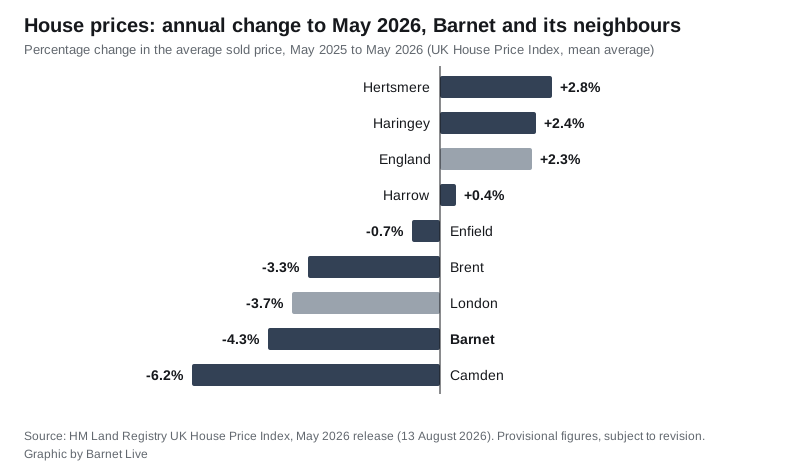
- Hertsmere (Borehamwood, Potters Bar): £562,261, up 2.8%
- Haringey: £633,853, up 2.4%
- Harrow: £530,021, up 0.4%
- Enfield: £469,164, down 0.7%
- Brent: £548,895, down 3.3%
- London as a whole: £544,814, down 3.7%
- Barnet: £590,583, down 4.3%
- Camden: £805,837, down 6.2%
- England: £292,095, up 2.3%
So the pattern is not “London is falling and Barnet is falling with it”. Two neighbours are rising, one is flat, and Barnet sits with the inner-London boroughs where prices had furthest to fall. Barnet’s average remains higher than every neighbour except Haringey and Camden.
Which homes fell most
Every property type in the borough is down on the year, but not equally:
- Flats and maisonettes: £368,845, down 5.9%. The steepest fall, and the biggest share of what actually sells.
- Detached: £1,540,509, down 4.8%.
- Semi-detached: £831,097, down 3.1%.
- Terraced: £623,216, down 2.4%. The most resilient type.
The average price paid by a first-time buyer was £463,534, against £485,911 in May 2025, a fall of 4.6% or about £22,400. That is the one line in this release that reads as good news for a large group of residents. Since flats are the entry point for most first-time buyers in Barnet, the two figures move together.
Two caveats worth reading before you quote a number
UKHPI is a mean average, not a median. The Land Registry builds it from every registered sale, so a handful of very expensive sales in Hampstead Garden Suburb or Totteridge pull the borough figure up. Half of Barnet’s homes sell for less than the headline number, and the median is not published at borough level.
Recent transaction counts are incomplete. The index shows 240 sales in Barnet in May 2025 and lower provisional counts for early 2026 (172 in both February and March), but the Land Registry warns that recent months fill in for a year or more as registrations arrive, so those counts should not be read as a collapse in activity.
What it means for you
- Selling: on the borough average, a home worth £633,000 last July would be valued about £42,500 lower today. Agents’ asking prices lag sold prices, so check what has actually completed on your road on the Land Registry price paid data rather than what is listed.
- Buying: the annual fall is biggest in flats, and the first-time buyer average is down about £22,400 in a year. Three months of small monthly rises since February suggest the floor may have been found, but three months is not a trend.
- Council tax and valuations: none of this changes your band. Bands are set on 1991 values, and the Barnet council tax bands page explains what each band pays in 2026-27.
- Longer view: our standing Barnet house prices page holds the by-type breakdown, the priciest streets and the questions people ask most, and is updated with each release. For the supply side, the Barnet planning news page tracks the big schemes at Colindale and Brent Cross that are adding flats to the market.
The next Land Registry release, covering June 2026, is due in mid-September.
Have your say