
13,185 Barnet residents claimed out-of-work benefits in July, 5.0% of those aged 16 to 64. Cricklewood is on 8.5%, Hampstead Garden Suburb on 2.1%.
Barnet’s borough-wide jobs figure barely moved last month. Underneath it, one ward has four times the claimant rate of another.
The July 2026 claimant count, published by the Office for National Statistics through nomis, records 13,185 claimants in Barnet, 5.0% of residents aged 16 to 64. That is 50 more than June and 300 fewer than July last year, when the figure was 13,485 and the rate 5.2%.
Break it down by ward and the borough splits in two.
Ward by ward
Eight of Barnet’s 24 wards sit above the borough average. The highest is Cricklewood on 8.5%. The lowest is Garden Suburb, covering Hampstead Garden Suburb, on 2.1%.
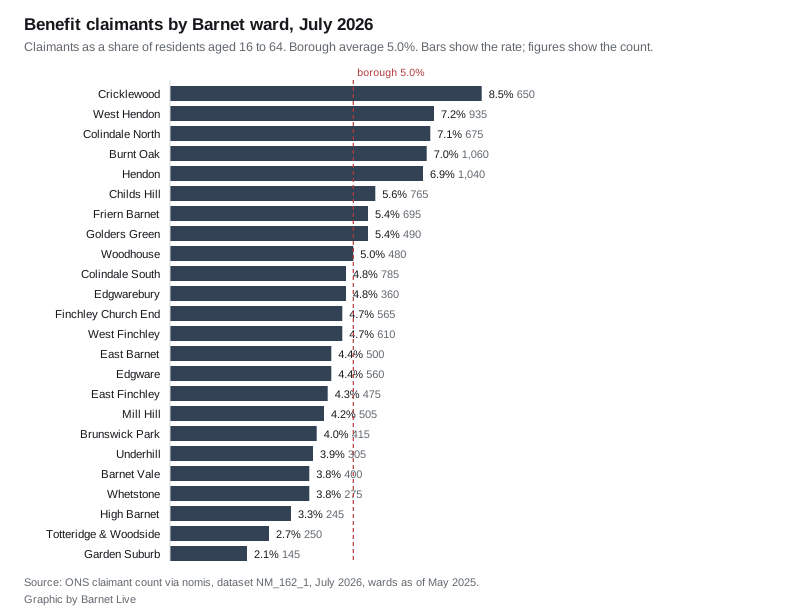
The five highest, with the number of claimants:
| Ward | Rate | Claimants |
|---|---|---|
| Cricklewood | 8.5% | 650 |
| West Hendon | 7.2% | 935 |
| Colindale North | 7.1% | 675 |
| Burnt Oak | 7.0% | 1,060 |
| Hendon | 6.9% | 1,040 |
And the five lowest:
| Ward | Rate | Claimants |
|---|---|---|
| Garden Suburb | 2.1% | 145 |
| Totteridge & Woodside | 2.7% | 250 |
| High Barnet | 3.3% | 245 |
| Barnet Vale | 3.8% | 400 |
| Whetstone | 3.8% | 275 |
Rate and volume are not the same thing. Burnt Oak has the largest number of claimants of any Barnet ward at 1,060, but Cricklewood has the highest rate. Colindale South has 785 claimants, more than Cricklewood, on a rate of 4.8%, because it has a much larger working-age population.
What this number is, and is not
The claimant count is not the unemployment rate, and the ONS is explicit about that. Its methodology note says the measure “does not attempt to measure unemployment”, which is defined internationally as people out of work, actively seeking work and available to start.
Two practical differences matter when reading these ward figures:
- It counts people claiming Universal Credit who are in the Searching for Work conditionality regime, plus Jobseeker’s Allowance claimants.
- People can be in that regime while working part time on low earnings. So the count includes some people who have a job.
How Barnet compares
Barnet’s 5.0% is below the London rate and above the UK one. On the same July 2026 release:
- London: 349,355 claimants, 5.6%
- United Kingdom: 1,690,970 claimants, 3.9%
- Barnet: 13,185 claimants, 5.0%
Ranked against the other 32 London boroughs and the City, Barnet is 18th on rate, level with Hounslow. Newham, Haringey and Barking and Dagenham are joint highest at 7.5%. Richmond upon Thames is lowest of the boroughs at 2.6%.
By age
The 25 to 49 group accounts for most of the total: 8,310 claimants in July, down from 8,470 a year earlier. The other bands:
- 16 to 24: 1,635, exactly the same as July 2025
- 50 and over: 3,240, down from 3,380 a year earlier
- 65 and over: 215, up from 185
What it means for you
If you are claiming, or about to, the two things worth knowing are the rules on your own conditionality regime and where your nearest Jobcentre is. The Universal Credit guidance sets out what is required of claimants in each group, and the DWP runs a Jobcentre finder by postcode. Vacancies advertised through Jobcentre Plus are on Find a job.
The ward figures also tell you something about the borough beyond jobs. The five highest-rate wards run down Barnet’s western side and along its southern edge: Cricklewood, West Hendon, Colindale North, Burnt Oak and Hendon. Four of the five lowest are in the north, around Totteridge, Whetstone and the two Barnet wards. The exception is Garden Suburb, in the south of the borough, which has both the lowest rate at 2.1% and the fewest claimants at 145. It is the same geography you can see in our Barnet house prices page and in council tax bands across the borough.
The next monthly release covers August 2026.
Sources
- ONS claimant count via nomis, dataset NM_162_1, July 2026, borough and ward level (wards as of May 2025)
- Claimant Count methodology, Office for National Statistics
Update, 17 September 2026: the ONS August release revised Barnet’s July 2026 claimant count down to 12,920, from the 13,185 first published, with a rate of 4.9%. Ward figures for July moved too; Cricklewood now reads 8.2%. The figures above are as first published. The August figures are in our August claimant count report.
Have your say